RGB Ramp Module
Helping your users interpret data.
In this post we’ll look at a simple one-file JavaScript module that generates color ramps (lists of colors arranged in a linear gradient). The colors can be applied to data to highlight items of interest. Foreground (text) color is chosen automatically for visibility against the backgound color.
Overview
When displaying data you can give the viewer cues to help them identify outliers, trends, and max or min values. This could be via sorting, graphing, icons, or other approaches.
Or, as described here, colors can be used to give the viewer hints about which items they should focus on. (Of course you should never depend exclusively on color to present data as some of your users may have trouble diffentiating between colors or may rely on screen-readers.)
Here’s an example table displaying fictional database report times where rows with longer than normal response times are flagged in shades of red and those with shorter than normal times are flagged in green.

The rgbramp.js Module
The module exposes two classes, Rgb, and Segment.
-
Rgb
Encodes the Red, Green, and Blue values for a color, and provides utility functions for computing the HTML color code, and calculating the contrasting text color.
-
Segment
Stores a starting color (Rgb), ending color, and total number of colors in the gradient (including the start and end color).
And, three functions:
-
ramp()
Given an array of Segments and the number of colors in each segment it interpolates the colors for each segment and returns them all as an array of Rgb objects.
-
applyColors()
Given a list of Rgb objects defining the gradient(s), apply appropriate colors from this list based on the value of a data-attribute on each item. This function will collect all the data values, determine the minimum and maximum value and will determine the correct color to apply to each element.
-
applyColorsIndex()
This function is similar to applyColors() but rather than computing each index it assumes the data value is an index to use from the colors array.
Usage
First include the symbols needed from the rgbramp module:
import { Rgb, Segment, ramp, applyColors, applyColorsIndex }
	from '/rgbramp.js';
Define the endpoints of the color ranges and compute all the colors:
let colors = ramp(
	new Segment(new Rgb(0, 200, 0), new Rgb(200, 250, 200), 3),
	new Segment(new Rgb(200, 200, 200), new Rgb(200, 200, 200), 4),
	new Segment(new Rgb(255, 200, 200), new Rgb(200, 0, 0), 3)
);
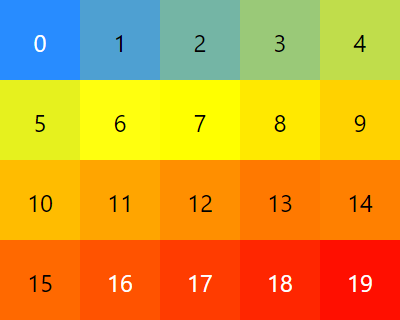
Here’s a visualization of the computed colors.
They are returned in an array of Rgb objects with 3 for the
first (green) segment, 4 for the second (gray) segment,
and 3 for the third (red) segment.

Next define the elements to be colorized. In this case we’ll define a table where each row has a “data-val” attribute that holds the number of milliseconds of response time.
<table class="table table-sm">
	<thead>
		<tr>
			<th>Start</th>
			<th>Query ID</th>
			<th>Elapsed (ms)</th>
		</tr>
	</thead>

	<tbody>
		<tr data-val="1200">
			<td>06:44:00</td>
			<th>111234</th>
			<td>1,200</td>
		</tr>
		<tr data-val="1330">
			<td>07:59:22</td>
			<th>111235</th>
			<td>1,330</td>
		</tr>
		<tr data-val="910">
			<td>08:01:11</td>
			<th>111236</th>
			<td>910</td>
		</tr>
		<tr data-val="2250">
			<td>08:01:42</td>
			<th>111237</th>
			<td>2,250</td>
		</tr>
		<tr data-val="500">
			<td>08:32:42</td>
			<th>111238</th>
			<td>500</td>
		</tr>
	</tbody>
</table>
Finally, call applyColors(). Notice that this function takes the colors array we obtained from the call to ramp().
It will first collect the values from all elements on the page with a “data-val” attribute, determine the minimum and maximum value, and will compute the proper index in to the color array based on the value for each item. It will then set the color and background-color styles.
applyColors('data-val', colors);
Resulting in the table we saw in the Overview:
You can get the code for this post here: GitHub | johnharp/rgbramp